Diabetes & Food Access Analysis
Understanding How Food Accessibility Impacts Diabetes Rates Across U.S. Counties

Project Overview
This project analyzes U.S. county health rankings and USDA food access research data to understand how food accessibility impacts diabetes rates across different communities. Access to healthy food is vital for human health, yet millions of Americans live in food deserts, areas where fresh, nutritious food is difficult to obtain.
When people lack access to affordable, healthy food options, they often resort to processed, high-calorie foods, which increases their risk of developing Type 2 diabetes. This study examines the correlation between food accessibility and diabetes rates, illuminating the broader implications of food access disparities, wealth inequality, and public health.
Research Question
How does food accessibility impact diabetes rates across U.S. counties, and what role do socioeconomic factors play in this relationship?
Data Sources
2019 County Health Rankings
Health outcomes, behaviors, and demographics for approximately 3,100 U.S. counties, providing comprehensive county-level health data.
2019 USDA Food Access Research Atlas
Food accessibility and socioeconomic indicators for approximately 72,000 census tracts, detailing food desert characteristics.
Both datasets were downloaded as CSV files, cleaned, and merged in Python via county name. Data processing involved filtering unnecessary columns, converting "Null" values, and transforming demographic metrics into percentages. A composite food access risk score was created by combining indicators like low-income, low-access, and vehicle availability.
Key Findings from Exploratory Data Analysis
Correlation Heatmap Analysis
The correlation heatmap reveals the relationships between all non-categorical variables in our dataset, providing crucial insights into how different factors relate to diabetes rates across U.S. counties.
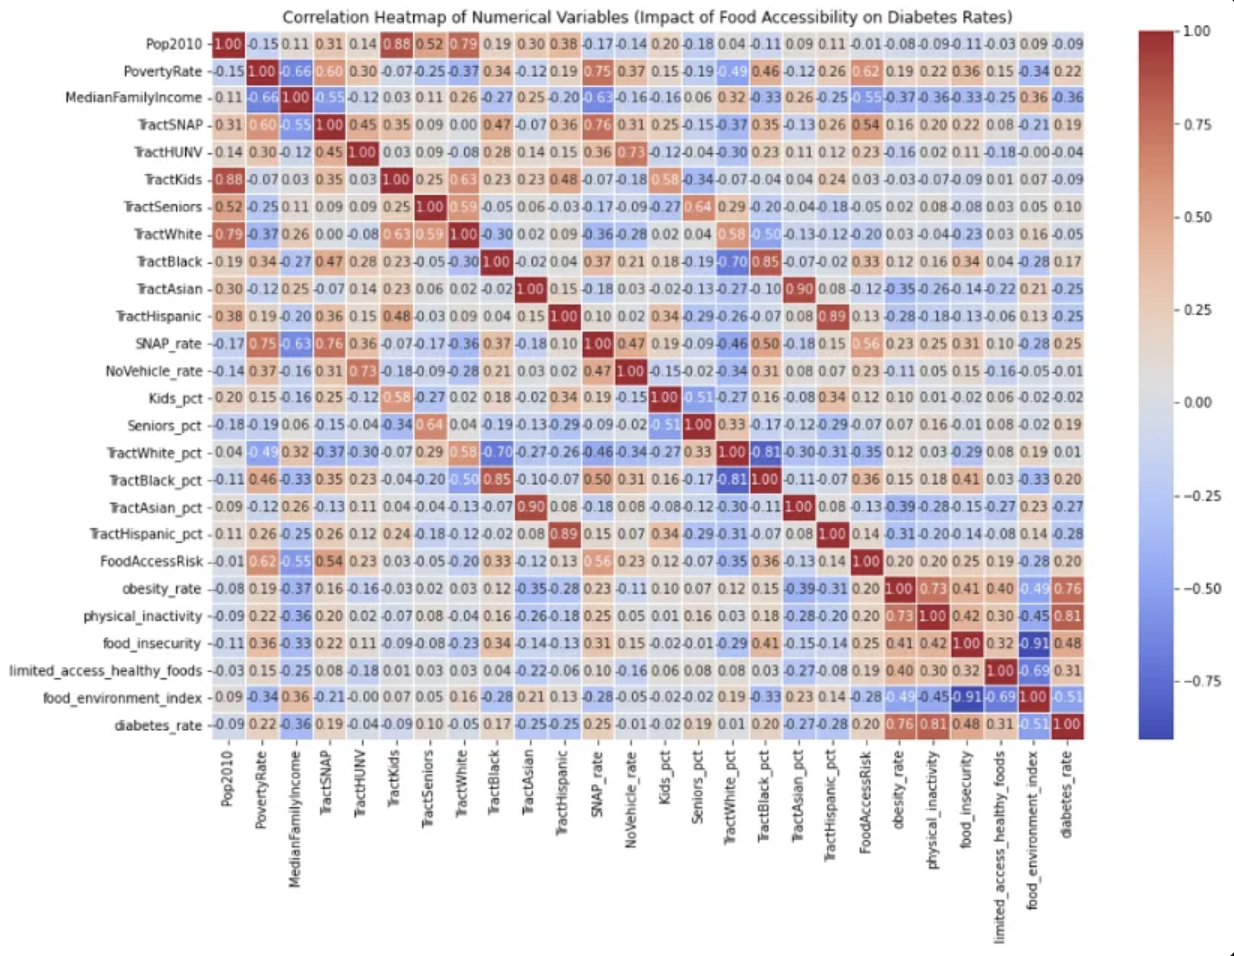
Correlation heatmap showing relationships between diabetes rates and various health, socioeconomic, and food access factors
Physical Inactivity
Strong positive correlation with diabetes rates, indicating lifestyle factors play a crucial role.
Obesity Rate
Strong positive correlation, closely linked with physical inactivity patterns.
Food Environment Index
Medium negative correlation - better food environments correlate with lower diabetes rates.
Food Insecurity
Medium positive correlation, showing food access significantly impacts diabetes prevalence.
Distribution Analysis
The histogram analysis revealed that food insecurity and limited access to healthy foods are not evenly distributed across counties. This indicates that some states or counties have much worse food access, making them potential high-risk diabetes areas. Poverty and food access are strongly right-skewed, meaning that some counties suffer from extreme poverty and food insecurity, which likely contributes to higher diabetes rates.
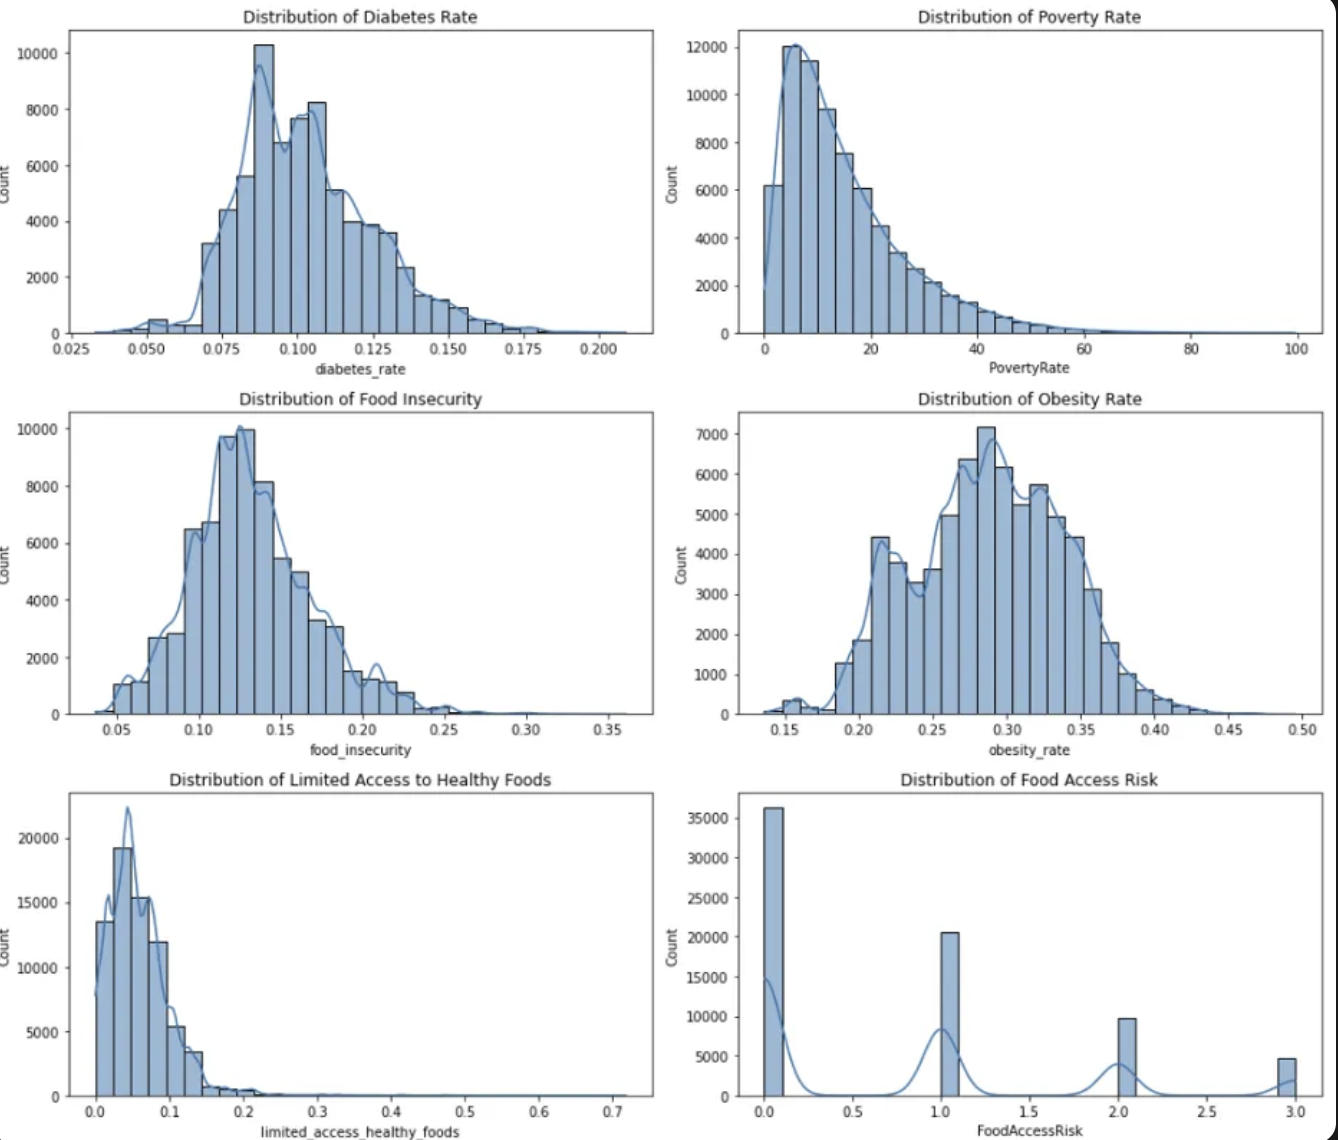
Histogram distributions showing the spread of diabetes rates, food access indicators, and socioeconomic factors across counties
Food Access Risk Levels
The boxplot analysis showed a clear upward trend in diabetes rates as food access risk levels increased. This indicates a strong correlation between higher food access risk levels and higher diabetes rates, confirming that regions with low food access correlate with higher diabetes prevalence.
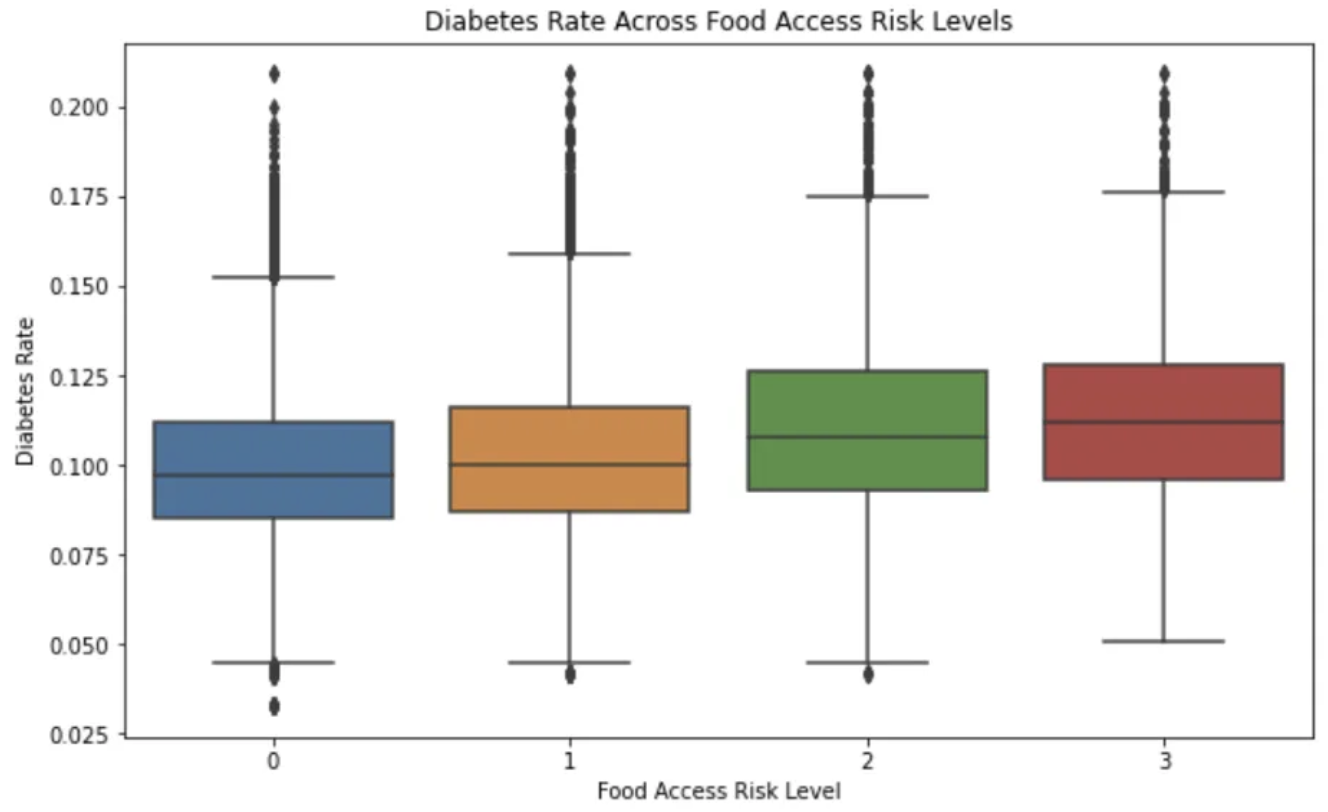
Boxplot showing the relationship between food access risk levels and diabetes rates across counties
Instrumental Variable (IV) Regression Analysis
To address potential endogeneity concerns, the correlation between predictors and unexplained variation in the dependent variable, implementing an IV regression model.
Methodology
- Data Grouping: Clustered states into four regions (West, South, Northeast, Midwest) to capture larger regional trends
- Variable Selection: Used LassoCV algorithm with 5-fold cross-validation to identify 14 key predictors
- Endogeneity Testing: Performed Durbin-Wu-Hausman Test on the obesity-food insecurity interaction term
- Instruments: Used 'Seniors_pct', 'Urban', and 'SNAP_rate' as instrumental variables
IV-2SLS Model Results
The model explains 31.6% of variation in diabetes rates and is highly statistically significant.
Key Predictor: Obesity-Food Insecurity
A one-unit increase in the obesity-food insecurity interaction is associated with a 1.82-unit increase in diabetes rate.
Logistic Regression Analysis
We developed a logistic regression model to predict high diabetes risk at the county level, transforming diabetes rates into a binary outcome to assess the likelihood of higher diabetes risk based on food access and socioeconomic factors.
Model Performance
Key Insights
- Limited access to healthy foods increases diabetes odds by 40%
- Higher median family income strongly reduces diabetes risk
- SNAP enrollment is associated with 13.7% higher diabetes odds
- Senior population increases diabetes risk by 19.4%
Demographic Patterns
The analysis revealed distinct demographic patterns: counties with higher percentages of Black residents exhibited a 16.9% increase in the odds of diabetes prevalence, while higher percentages of Hispanic and Asian populations were associated with 58% and 35% lower odds, respectively. These findings highlight significant health disparities, potentially reflecting differences in lifestyle, diet, healthcare access, or community resources across ethnic groups.
Literature Review Context
Our findings align with existing research on food accessibility and diabetes. Previous studies have shown that food insecurity is linked to higher HbA1c levels and poorer blood sugar management, while neighborhood socioeconomic environments significantly impact Type 2 diabetes risk. However, our research extends this understanding by quantifying the specific relationships between food access metrics and diabetes prevalence at the county level.
Tools & Technologies
Conclusions & Policy Implications
Our analysis confirms that food accessibility plays a major role in diabetes rates across the U.S. Counties with limited access to healthy food consistently show higher diabetes prevalence, reinforcing the broader impact of food deserts on public health. The research points to the need for practical solutions: expanding food assistance programs, improving access to grocery stores, and addressing economic disparities to help reduce diabetes rates and promote healthier communities.
While our models capture strong predictors, they suggest that additional factors, such as healthcare access, education, and lifestyle choices, also contribute to diabetes prevalence. Future research should incorporate these elements to develop more comprehensive intervention strategies.